Last month had more mobile traffic than usual due to special events. April numbers are back to where they were trending previously.
ND.edu
Traffic
- 716,251 views by 249,601 people
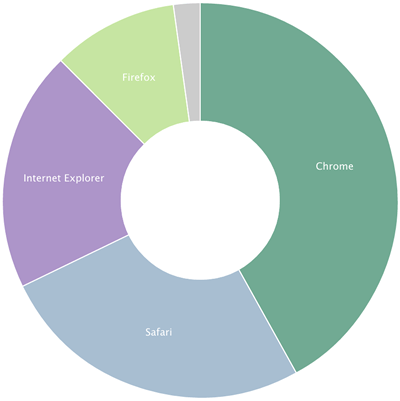
Browsers
- Chrome 42%
- Safari 26%
- IE 20%
- IE11 12%
- IE10 3%
- IE9 3%
- IE8 1%
- Firefox 10%
Platforms (Overall)
- Windows 56% (+3%)
- Mac 22%
- iOS 15% (-3%)
- Android 5%
Mobile Traffic
- Total 22% (-6%)
- iOS 71%
- Android 22%
- Windows 6%
- Windows Phone 7.5 0.8%
- Blackberry 0.2%
m.nd.edu
Traffic
- 234,705 views by 10,728 people
Top Content (General)
- Dining
- Athletics
- Webcams
- Photos
- Map
Top Content (Students)
- Dining
- Irish1Card
- Map
- Transit
- Academics
Platforms
- iOS 82%
- Android 15%
- Macintosh 1.1%
- Windows 1%
Conductor
462 live sites (+6)
- Film Theater and Television
- Investment Office
- Warren Family Research Center for Drug Discovery and Development
- Lamplighters
- Turbomachinery Laboratory
- Dome
Traffic
- 4,347,593 views by 1,204,661 people
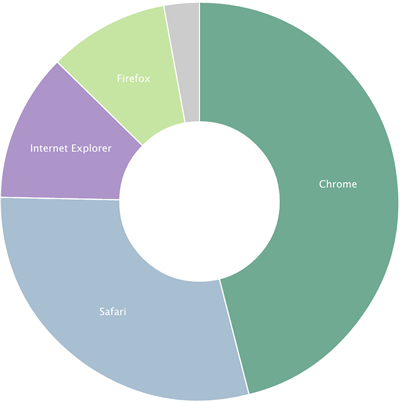
Browsers
- Chrome 46% (+3%)
- Safari 29%
- IE 12%
- IE11 8%
- IE10 1%
- IE9 2%
- IE8 1%
- Firefox 10%
Platforms
- Windows 48%
- Mac 28%
- iPhone 12%
- Android 6%
- iPad 5%
Mobile Traffic
- Total 28%
- iOS 72%
- Android 22%
- Windows 4%
- Windows Phone 0.6%
- Blackberry 0.4%
Stats are compiled from Gaug.es by Github and Google Analytics.