March saw a 6% jump of mobile traffic on www.ND.edu. The new Transit module for the Notre Dame mobile app also jumped to #3 on the Student charts this month.
ND.edu
Traffic
- 924,799 views by 330,443 people
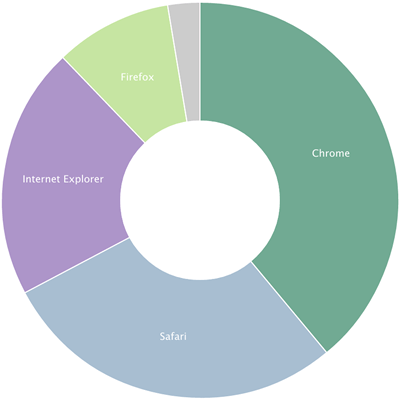
Browsers
- Chrome 39%
- Safari 28%
- IE 21%
- IE11 13%
- IE10 3%
- IE9 3%
- IE8 1%
- Firefox 10%
Platforms (Overall)
- Windows 53% (-5%)
- Mac 20%
- iOS 18% (+3%)
- Android 7% (+3%)
Mobile Traffic
- Total 28% (+6%)
- iOS 71% (-3%)
- Android 23% (+4%)
- Windows 5%*
- Windows Phone 7.5 0.8%
- Blackberry 0.3%
m.nd.edu
Traffic
- 237,447 views by 12,614 people
Top Content (General)
- Dining
- Athletics
- Webcams
- Photos
- Athletics Highlights
Top Content (Students)
- Dining
- Irish1Card
- Transit
- Map
- Academics
Platforms
- iOS 81%
- Android 14%
- Windows 1.7%
- Macintosh 2%
Conductor
455 live sites (+5)
- EMBAC Midwest Regional Conference
- Executive Integral Leadership Program (password protected)
- The Laetare Medal
- Hall Presidents Council
- Catering
Traffic
- 4,823,716 views by 1,323,300 people
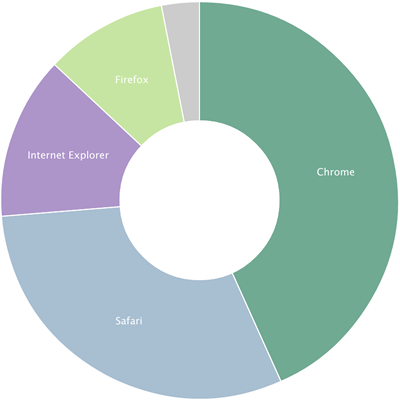
Browsers
- Chrome 43%
- Safari 30%
- IE 13%
- IE11 8%
- IE10 2%
- IE9 2%
- IE8 1%
- Firefox 10%
Platforms
- Windows 48%
- Mac 26%
- iPhone 12%
- iPad 7%
- Android 6%
Mobile Traffic
- Total 30%
- iOS 74%
- Android 21%
- Windows 8 4%
- Windows Phone 0.6%
- Blackberry 0.3%
Stats are compiled from Gaug.es by Github and Google Analytics.