While we continue to publish monthly stats on this blog, I always find the yearly stats the most interesting. Those numbers are what show the big picture and how things really moved. Pay close attention to Mobile Trends section, where you’ll see some pretty large percentages of mobile traffic for some sites.
ND.edu
Browsers
January to December changes:
- Internet Explorer 31% → 21%
- IE11 9% → 14%
- IE10 5% → 3%
- IE9 12% → 3%
- IE8 5% → 1%
- IE7 1% → 0%
- Safari 28% → 28%
- Chrome 24% → 37%
- Firefox 14% → 11%
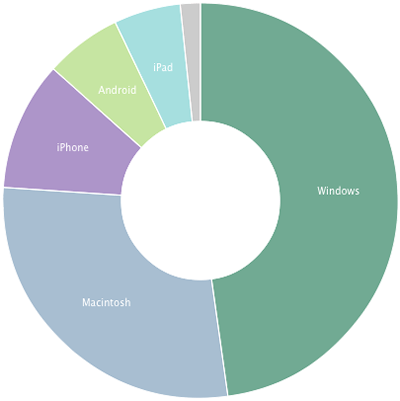
Platforms
January to December changes:
- Windows 60% → 55%
- Macintosh 22% → 23%
- iOS 13% → 15%
- Android 4% → 5%
Conductor
Conductor finished the year with 435 live sites, an increase of 67.
Browsers
January to December changes:
- Chrome 34% → 44%
- Safari 30% → 30%
- Internet Explorer 19% → 13%
- IE11 6% → 7%
- IE10 3% → 2%
- IE9 6% → 3%
- IE8 3% → 1%
- IE7 0% → 0%
- Firefox 13% → 10%
Platforms
January to December changes:
- Windows 52% → 48%
- Macintosh 28% → 28%
- iOS 14% → 16%
- Android 4% → 6%
m.ND.edu
January to December changes:
iOS 75% → 84%
Android 24% → 16%
Mobile Trends
Select group of sites and their total mobile traffic changes from January to December:
- www.ND.edu 16% → 22%
- Admissions 24% → 35%
- Blogs 28% → 38%
- Calendar 45% → 84%
- Gameday 44% → 56%
- Magazine 39% → 42%
- News 29% → 34%
- Tour 33% → 38%
We’ll be back next month with our regularly scheduled stats for January.