Not much happened as far as stats moves in October. Most browsers remained flat with some 1-2% shifts. We also added ten new sites to Conductor, bringing our grand total to 418 as of October 31.
ND.edu
Traffic
- 928,328 views by 314,185 people
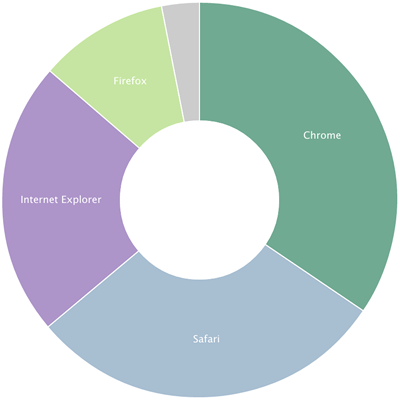
Browsers
- Chrome 34%
- Safari 29%
- IE 22%
- IE11 13%
- IE10 4%
- IE9 4%
- IE8 2%
- Firefox 11%
Platforms (Overall)
- Windows 54%
- Mac 21%
- iOS 18%
- Android 6%
Mobile Traffic
- Total 24.8%
- iOS 71%
- Android 23%
- Windows 5%*
- Windows Phone 7.5 1%
- Blackberry 0.4%
m.nd.edu
Traffic
- 232,294 views by 14,049 people
Top Content (General)
- Dining
- Athletics
- Photos
- Map
- Webcams
Top Content (Students)
- Dining
- Map
- Academics
- Irish1Card
- Calendar
Platforms
- iOS 80%
- Android 16%
- Macintosh 2%
- Windows 1%
- Windows Phone 0.2%
Conductor
- 418 live sites (+10)
Traffic
- 4,595,336 views by 1,238,309 people
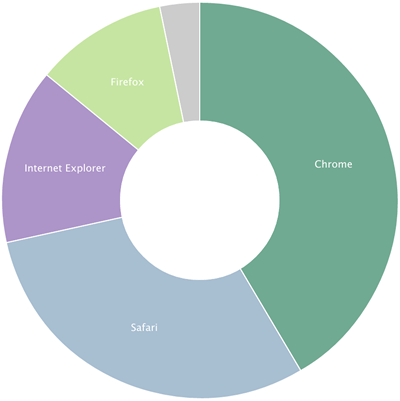
Browsers
- Chrome 41%
- Safari 30%
- IE 14%
- IE11 8%
- IE9 3%
- IE10 2%
- IE8 2%
- Firefox 11%
Platforms
- Windows 49%
- Mac 27%
- iPhone 11%
- iPad 6%
- Android 6%
Mobile Traffic
- Total 28%
- iOS 71%
- Android 22%
- Windows 8 4.3%
- Windows Phone 0.7%
- Blackberry 0.5%
Stats are compiled from Gaug.es by Github and Google Analytics.
Can you add more data about traffic beyond total for the nd.edu page? It would be interesting to see how the top links do on a regular basis — perhaps where people go next and in what numbers looking at the 10 content links on the top blue and yellow bars as well as links to news, events, audience pages, etc.
I’ll see what I can do.
Hi Erik,
This information is super useful – thanks! Would it be possible, though, to add the list of the new Conductor sites added each month so we can stay up-to-speed on what is new?
Thanks!
Joanne
Certainly. Will start with the November post.