Welcome back students! This month saw an increase in iOS and mobile traffic with a (nearly) equal drop in Windows traffic. August also resulted in a huge traffic spike to our m.nd.edu (and native apps) properties.
ND.edu
Traffic
- 706,337 views by 211,204
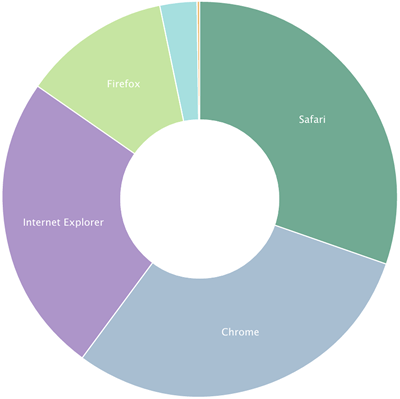
Browsers
- Chrome 30%
- Safari 30%
- IE 25%
- IE11 14%
- IE9 5%
- IE10 4%
- IE8 2%
- Firefox 12%
Platforms (Overall)
- Windows 55% (-4%)
- Mac 22%
- iOS 16%
- Android 5%
Mobile Traffic
- Total 25% (+6.6%)
- iOS 72%
- Android 22%
- Windows 4.8%*
- Windows Phone 7.5 1%
- Blackberry 0.4%
m.nd.edu
Traffic
- 468,572 views by 20,654 people
Top Content (General)
- Academics
- Dining
- Map
- Athletics
- Photos
Top Content (Students)
- Academics
- Dining
- Map
- Calendar
- Irish1Card
Platforms
- iOS 81% (+5%)
- Android 15%
- Macintosh 1%
- Windows 1%
- Windows Phone 0.2%
Conductor
- 397 live sites (+4)
Traffic
- 3,748,128 views by 999,470
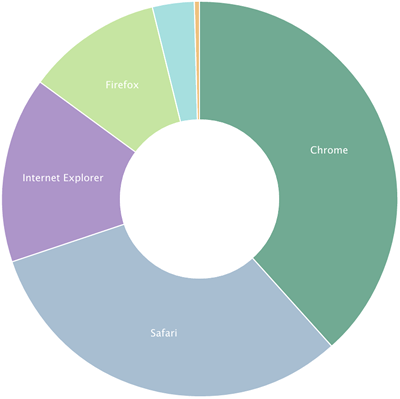
Browsers
- Chrome 38%
- Safari 32%
- IE 15%
- IE11 8%
- IE9 3%
- IE10 2%
- IE8 2%
- Firefox 11%
Platforms
- Windows 48% (-4%)
- Mac 26%
- iPhone 12%
- iPad 7%
- Android 6%
Mobile Traffic
- Total 32.38%
- iOS 72%
- Android 22%
- Windows 8 3.7%
- Windows Phone 0.8%
- Blackberry 0.5%
Stats are compiled from Gaug.es by Github and Google Analytics.