Overall, there was not much change in browser percentages. The largest shift this month was the drop in traffic to m.nd.edu and the associated native apps. This can be attributed to the “newness” effect from last month as well as students leaving for the summer.
ND.edu
Traffic
- 643,887 views by 172,428
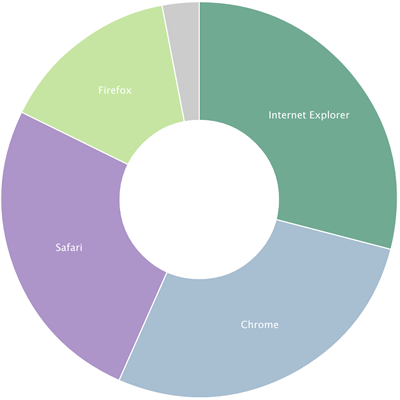
Browsers
- IE 29%
- IE11 11%
- IE9 7%
- IE10 7%
- IE8 3%
- IE7 0%
- Chrome 28%
- Safari 26%
- Firefox 15%
Platforms (Overall)
- Windows 61%
- Mac 22%
- iOS 12%
- Android 4%
Mobile Traffic
- Total 15.3%
- iOS 76%
- Android 22%
- Windows Phone 0.9%
- Blackberry 0.5%
m.nd.edu
Traffic
- 96,669 views by 8,887 people
Top Content
- Current Students
- OIT
- Dining
- Academics
- Athletics
Platforms
- iOS 82%
- Android 17%
- Windows 6%
- Macintosh 5%
Conductor
- 392 live sites (+11)
Traffic
- 3,100,316 views by 839,258
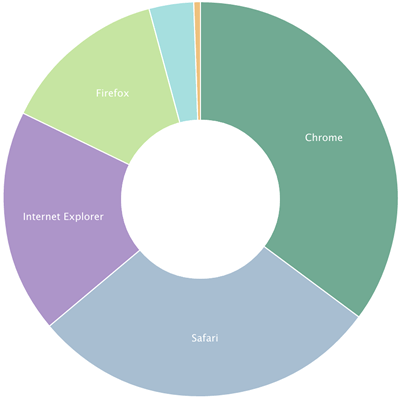
Browsers
- Chrome 35%
- Safari 29%
- IE 18%
- IE11 7%
- IE9 4%
- IE10 4%
- IE8 3%
- IE7 0%
- Firefox 14%
Platforms
- Windows 53%
- Mac 25%
- iPhone 9%
- iPad 6%
- Android 5%
Mobile Traffic
- Total 26%
- iOS 74%
- Android 23%
- Windows Phone 0.7%
- Blackberry 0.7%
Stats are compiled from Gaug.es by Github and Google Analytics.