April saw the launch of launch of our new mobile app/site. The result being a jump in traffic to m.nd.edu and the native apps. Everything else was pretty flat from last month.
ND.edu
Traffic
- 754,588 views by 218,521 people
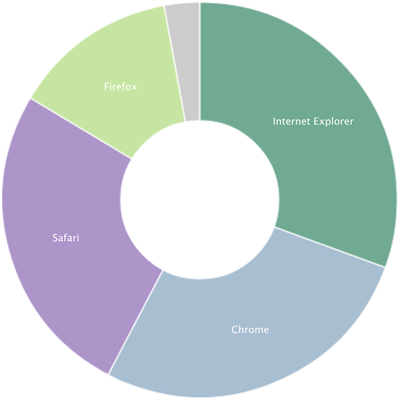
Browsers
- IE 31%
- IE9 9%
- IE11 9%
- IE10 8%
- IE8 3%
- IE7 0%
- Chrome 27%
- Safari 26%
- Firefox 13%
Platforms (Overall)
- Windows 61%
- Mac 22%
- iOS 12%
- Android 4%
Mobile Traffic
- Total 15.2%
- iOS 76%
- Android 22%
- Windows Phone 0.9%
- Blackberry 0.4%
m.nd.edu
Traffic
- 169,637 views by 14,916 people
Top Content
- Food
- Map
- Webcams
- Athletics
- Weather
Platforms
- iOS 80% (+10%)
- Android 19% (-3%)
- Macintosh 4%
- Windows 4%
Conductor
- 392 live sites (+11)
Traffic
- 3,676,266 views by 961,739 people
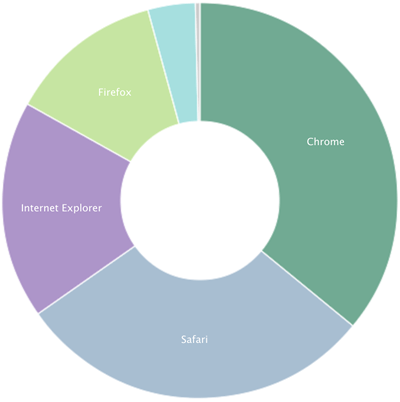
Browsers
- Chrome 36%
- Safari 29%
- IE 18%
- IE11 6%
- IE9 5%
- IE10 4%
- IE8 3%
- IE7 0%
- Firefox 13%
Platforms
- Windows 51%
- Mac 27%
- iPhone 9%
- iPad 6%
- Android 5%
Mobile Traffic
- Total 25%
- iOS 75%
- Android 22%
- Windows Phone 0.7%
- Blackberry 0.6%
Stats are compiled from Gaug.es by Github and Google Analytics.