Stat changes this month were pretty much nil. The biggest move for any browser was only about 2%. New this month (and going forward) is aggregated mobile percentages for all Conductor sites. February was 22% overall.
ND.edu
Traffic
- 741,308 views by 207,728 people
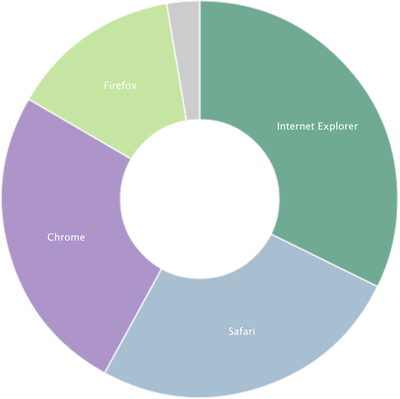
Browsers
- IE 32%
- IE9 14%
- IE11 9%
- IE10 4%
- IE8 4%
- IE7 1%
- Safari 26%
- Chrome 25%
- Firefox 14%
Platforms (Overall)
- Windows 62%
- Mac 22%
- iOS 11%
- Android 3%
Mobile Traffic
- Total 16%
- iOS 79%
- Android 19%
- Windows Phone 0.8%
- Blackberry 0.5%
m.nd.edu
Traffic
- 58,718 views by 5,178 people
Top Content
- Food
- Webcams
- Athletics
- Map
- Weather
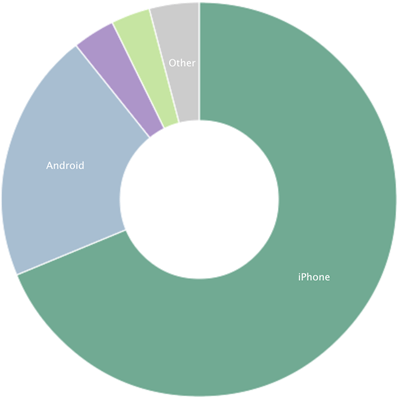
Platforms
- iPhone 69%
- Android 21%
- Macintosh 3%
- Windows 3%
- iPad 3%
- iPod 1%
Conductor
- 375 live sites (+3)
Traffic
- 3,299,236 views by 855,152 people
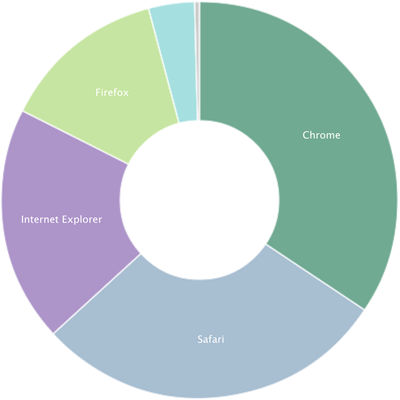
Browsers
- Chrome 34%
- Safari 29%
- IE 19%
- IE9 7%
- IE11 6%
- IE10 3%
- IE8 3%
- IE7 0%
- Firefox 13%
Platforms
- Windows 53%
- Mac 28%
- iPhone 8%
- iPad 6%
- Android 4%
Mobile Traffic
- Total 22%
- iOS 78%
- Android 19%
- Blackberry 0.7%
- Windows Phone 0.6%
Stats are compiled from Gaug.es by Github and Google Analytics.
Comments are closed.