


Boxplots, histograms, and scatter plots. Oh, my!
Posted on June 5, 2015 in Uncategorized by Eric Lease Morgan
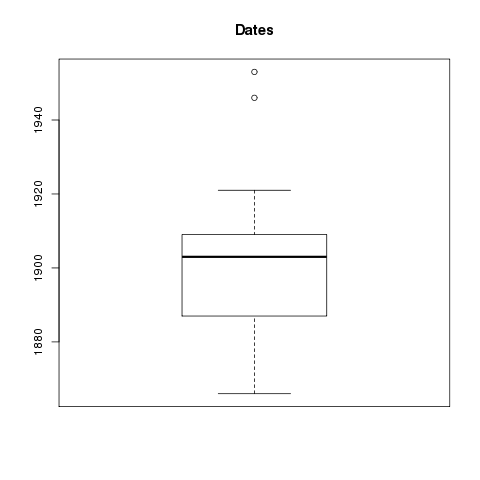
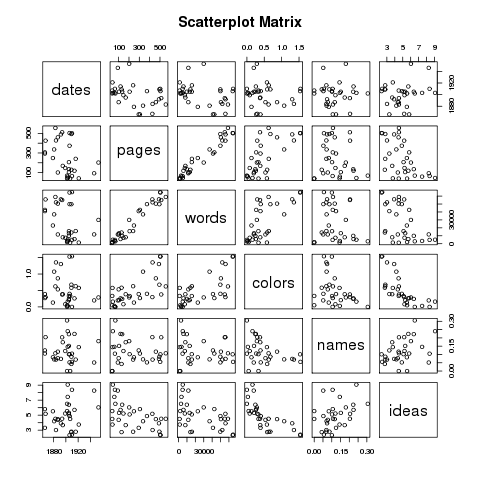
I have started adding visualizations literally illustrating the characteristics of the various “catalogs” generated by the HathiTrust Workset Browser. These graphics (box plots, histograms, and scatter plots) make it easier to see what is in the catalog and the features of the items it contains.

For example, read the “about page” reporting on the complete works of Henry David Thoreau. For more detail, see the “home page” on GitHub.